dYdX Analytics Dashboard
Analytics dashboard examining dYdX's daily and trading league results with publicly available API data.

Project Description
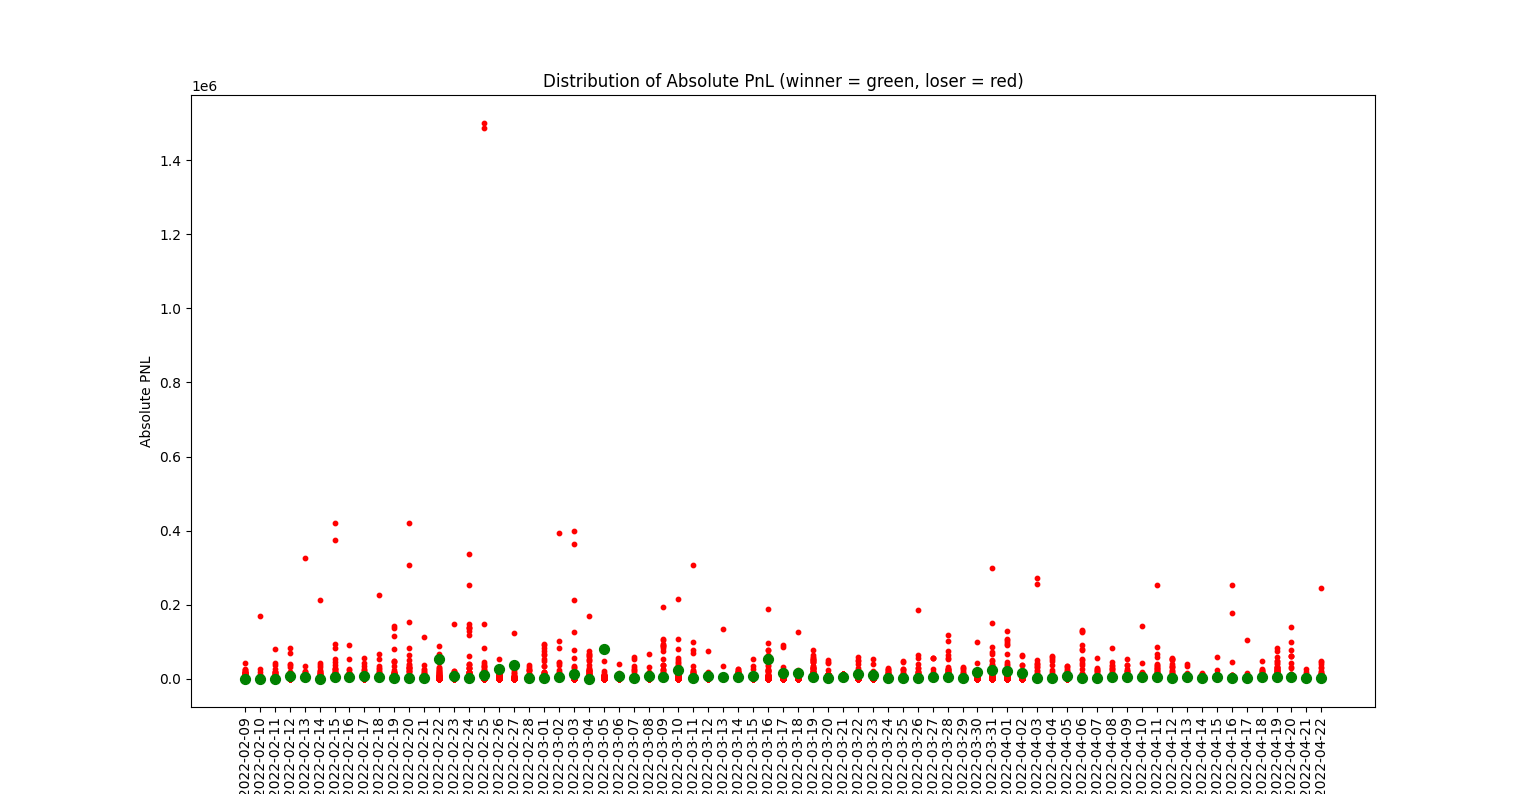
This project uses the dYdX API (https://docs.dydx.exchange/?json#public-http-api) to analyze data of the top daily/weekly traders. Data is fetched with Python and then visualized using the Matplotlib library and Jupyter. Every trader's unique and anonymous public ID corresponds to their absolute PNL and %PNL for any given day week, etc. We wanted to use this data to analyze existing trends to better understand what strategies the most successful traders use, how often the most successful traders win, and general market trends. We wanted to find what the wining strategies are (to the extent of the data) and how those vary based on different time frames (daily vs weekly).
How it's Made
This project pulled the dYdX API information to parse through the data of the top daily/weekly traders. This data was analyzed with Python and visualized using the Matplotlib library and Jupyter. Every trader's unique and anonymous public ID corresponds to their absolute PNL and %PNL for any given day week, etc. This code can be lightly adjusted to query this information on a regular basis and provide updated results as needed. The Information was also exported to an Excel and edited in Pivot table for easy searching by a non technical crowd.

