ETHtarium
Creating a 3D map of all of crypto. Visualizing suggested transaction routes from point-to-point.
Project Description
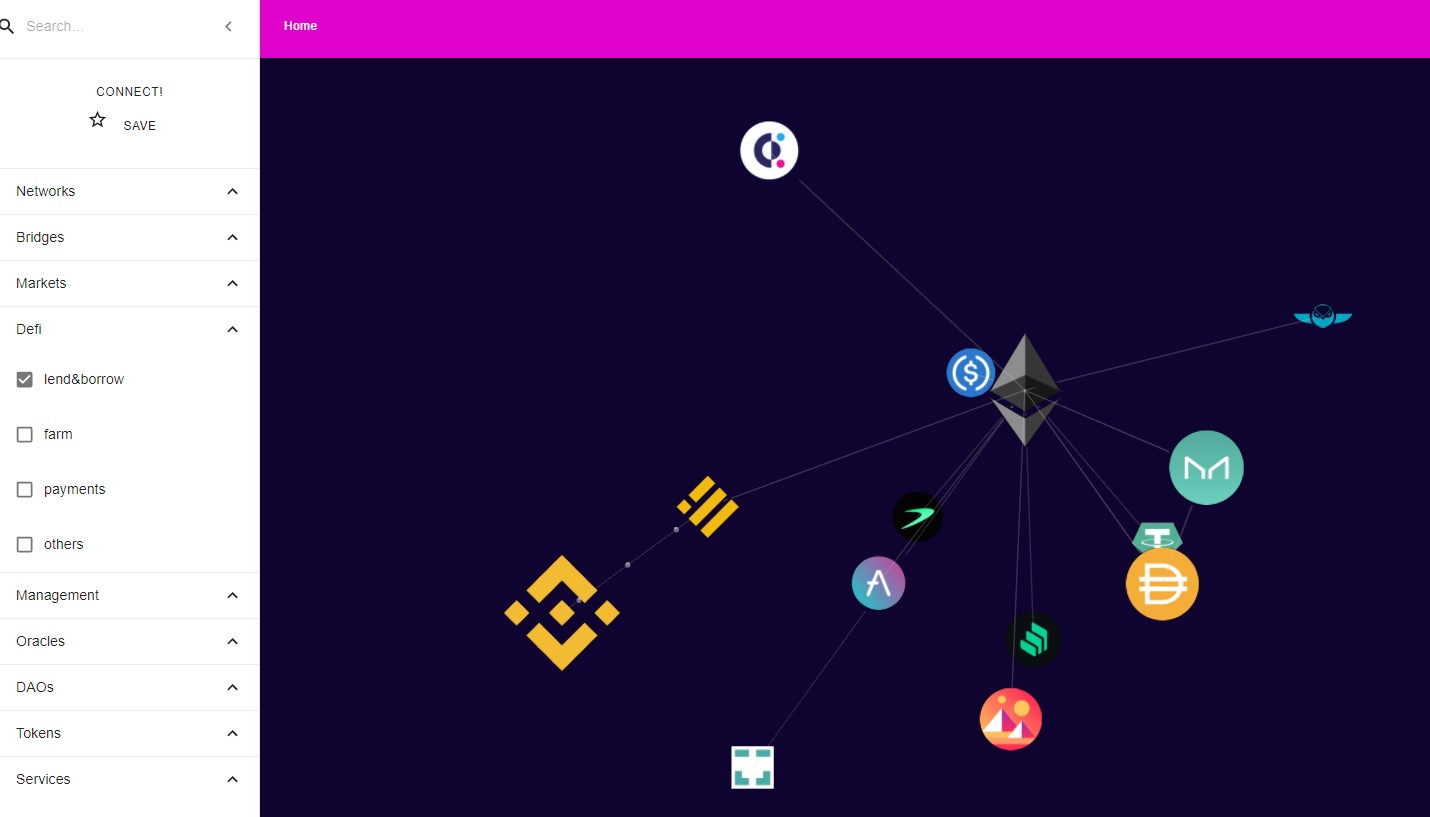
Creates a force-directed graph of Ethereum and its universe of EVM-compatible projects. Nodes are inspectable for data such as network ID, market price, volume, etc. Application allows users to request new subgraphs, add new nodes, connect to their wallet, displays in 3D, functions on mobile, and (amost) supports VR. Intended to promote ETHverse exploration, new project discovery, and eventually to map the creation of multi-step cross-protocol transactions.
How it's Made
Written as a ReactJS component. Used ThreeJS as our primary display engine. Imported basic price data from coingecko.com. Importing index data from theGraph where availalbe, requesting subgraphs be created and hosted where they are not available.
Hacky things and future work:
-Our node data display should eventually attach as pop-ups on hover/rollover of nodes within the main display.
-We found that many necessary bridges among networks and protocols, and the subGraphs to index them simply don't exist yet. So we needed a mechanism for users to request infrastructure as it evolves in the future.
-The display engine is easily overwhelmed with too much data. It burns out with much more than 10 items displayed. We were hoping for more like 100.
-Adding/subtracting items from the graph causes a recalculation of everything's position. That forces a wipe and redraw of the main window.
Worth mentioning:
-We set out to do this in 2D, but 3D wasn't much harder. We've even got mobile support and VR support is actually there, just untested.

